How Much Inventory Is in the Austin Housing Market Right Now?
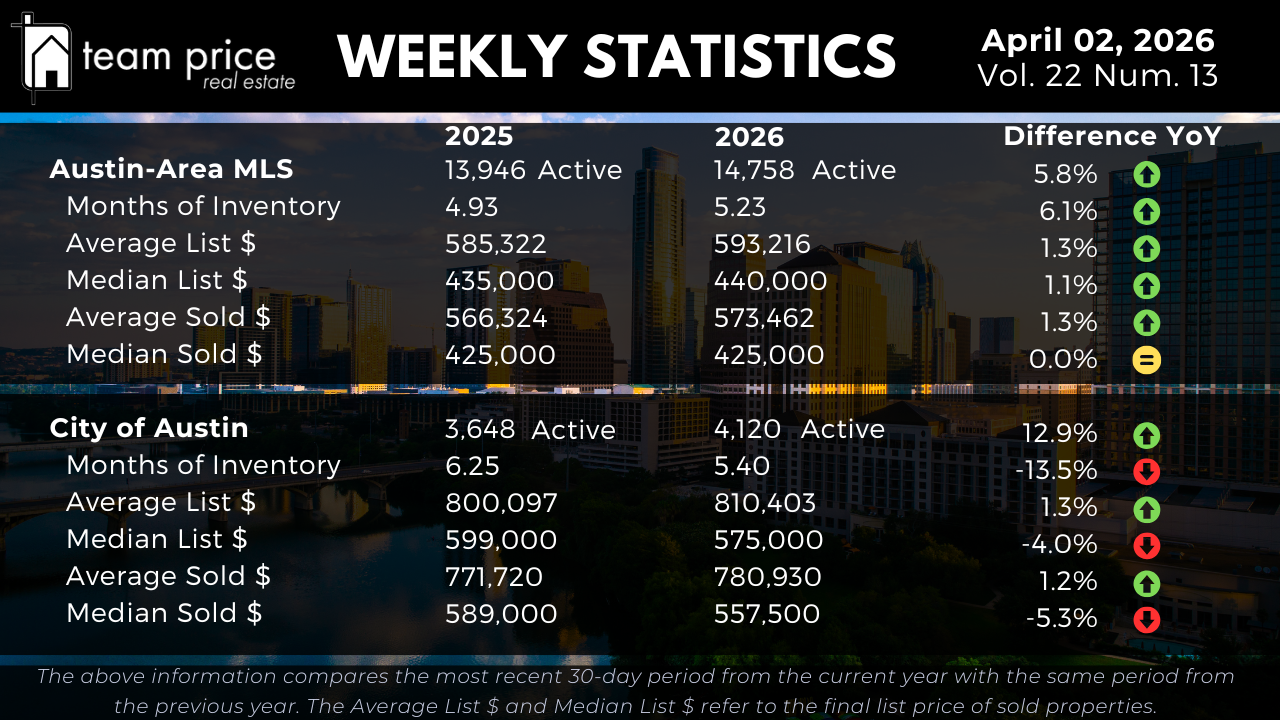
The Austin-area housing market now has 14,758 active listings, up 5.8% from 13,946 at this same point in 2025. That is a meaningful year-over-year increase that continues a trend of sustained inventory growth across Central Texas. Months of supply currently stands at 5.23, up from 4.93 a year ago — a 6.1% increase. At six months, most economists consider a market balanced. Austin-area MLS is approaching that threshold but has not crossed it.
Inside the City of Austin, the picture is more nuanced. Active listings total 4,120, up 12.9% year over year from 3,648. That is a much steeper rate of inventory growth than the broader MLS. At the same time, the City of Austin's months of supply actually improved, dropping from 6.25 to 5.40 — a 13.6% decrease. That means more homes are listed, but demand within city limits has kept pace well enough to pull the absorption rate down closer to equilibrium. Austin proper is moving away from a buyer's market by the months-of-supply measure, even as raw listing counts climb.
What Are Homes Selling for in the Austin-Area MLS This Month?
The average active list price across the Austin-Area MLS is $593,216, up 1.3% from $585,322 a year ago. The median active list price is $440,000, up 1.1% from $435,000. Those are modest gains — well within the margin of inflation — and suggest that sellers across the broader market are not aggressively repricing upward.
On the sold side, the average sold price is $573,462, up 1.3% year over year from $566,324. The median sold price sits at $425,000, unchanged from $425,000 at this same point in 2025 — a 0.0% difference. Flat is not falling, but it is also not recovering. For buyers, a flat median means the market is not running away from them. For sellers, it means pricing accurately matters more than ever because the data is not providing lift.
What Are Homes Selling for in the City of Austin Right Now?
The City of Austin tells a distinctly different story at the price level. The average active list price is $810,403, up 1.3% from $800,097 — consistent with the broader MLS trend. But the median active list price has dropped to $575,000 from $599,000 a year ago, a 4.0% decline. That divergence between average and median is significant. It suggests that while luxury and upper-tier homes are holding their asking prices, the middle of the City of Austin market is adjusting downward to attract buyers.
The average sold price in the City of Austin is $780,930, up 1.2% from $771,720 a year ago. The median sold price, however, has declined to $557,500 from $589,000 — a 5.3% year-over-year drop of $31,500. That is the most consequential number in this week's report for city buyers and sellers alike. Sellers in Austin proper who are pricing based on 2025 comps are likely overpriced. Buyers who have been watching the City of Austin market have real negotiating room backed by data.
Are Buyers Getting Deals Below List Price in Austin?
The sold-to-list price ratio for the Austin-area market is currently 97.28%, meaning the average home is selling for about 2.7% below its asking price. That is a meaningful negotiating gap in dollar terms — on a $573,000 home, that spread is roughly $15,600.
This month, 65.62% of all closed transactions sold below list price. Last month that figure was 68.10%, so the share of below-list closings is actually shrinking slightly. The share selling at list price held nearly steady at 20.99% this month versus 21.09% last month. The more notable shift is at the top: 13.39% of homes sold above list price this month, up from 10.81% last month and nearly matching the 13.11% recorded in March 2025. That uptick in above-list closings is worth watching. It may reflect competitive micro-pockets within the market where well-priced homes in strong locations are drawing multiple offers. The overall market still heavily favors negotiation, but pockets of competition are emerging.
Which Austin-Area Cities and ZIP Codes Are Seeing Price Growth?
Across the 30 cities tracked in Central Texas, 18 — or 60% — showed a month-over-month price increase while 12, or 40%, declined. That month-over-month reading suggests improving short-term momentum across the majority of the tracked cities. Year over year, the picture is more divided: 14 cities, or 47%, are showing gains while 16, or 53%, are lower than a year ago. More than half of the tracked cities remain below where they were in 2026.
The 75 ZIP codes tracked across Greater Austin reflect a similar dynamic. Month over month, 43 ZIP codes — 57% — posted price increases while 32, or 43%, declined. Year over year, the majority have not recovered: 30 ZIP codes, or 40%, are up year over year while 45, or 60%, are still below where they were twelve months ago.
Perhaps the starkest single data point in this section: when measured from the 12-month peak price, zero cities and zero ZIP codes are currently trading above their respective peaks. Every single market in the tracked universe — all 30 cities and all 75 ZIP codes — is below peak. The market is showing signs of stabilization and month-over-month improvement in many areas, but a full recovery to peak levels has not happened anywhere in Central Texas.
How Far Is the Austin Housing Market from Its Peak Prices?
The Austin-Area MLS peak comparisons show how much ground has been given up since the 2022 run-up. The average list price peaked at $708,929 in March 2023 and currently sits at $693,306, a drop of $15,623 or 2.2%. The median list price peaked at $539,900 in May 2022 and is now $469,995 — down $69,905 or 12.9%.
On the sold side, the average sold price peaked at $664,515 in May 2022 and currently stands at $563,978, a decline of $100,537 or 15.1%. The median sold price peaked at $538,000 in May 2022 and is now $425,000, a drop of $113,000 or 21.0%. Per-square-foot figures have also retreated sharply: the average sold price per square foot peaked at $324 in April 2022 and is now $250, down $74 or 22.8%. The median sold price per square foot peaked at $280 in April 2022 and is now $208, down $72 or 25.7%.
The City of Austin peak comparisons reflect a similar retreat, with some categories showing more recent peaks. The average list price peaked at $959,966 in September 2025 — less than a year ago — and has since dropped to $891,702, a decline of $68,264 or 7.1%. The median list price peaked at $658,589 in May 2022 and is now $599,995, down $58,594 or 8.9%. The average sold price peaked at $847,583 in May 2022 and stands at $769,509 today, a drop of $78,074 or 9.2%. The City of Austin median sold price peaked at $680,000 in May 2022 and is now $555,000, a decline of $125,000 or 18.4%. The average sold price per square foot peaked at $442 in May 2022 and is now $350, down $92 or 20.8%.
Note on City of Austin median sold price per square foot: The source data shows a peak of $393 in April 2022, a current value of $208, and a stated drop of $101. The math does not reconcile — $393 minus $101 equals $292, not $208. A drop from $393 to $208 represents a decline of $185, or 47.1%. The current value of $208 is used here as the most likely correct figure, but this line item should be verified against the source PDF before publishing.
What Is the Austin Real Estate Market Outlook for April 2026?
The Austin housing market in early April 2026 is defined by two parallel realities. Across the broader Austin-Area MLS, prices are holding — the median sold price is flat year over year at $425,000 and month-over-month momentum is building in the majority of cities and ZIP codes tracked. Inside Austin proper, prices are under more pressure, with the median sold price down 5.3% year over year and the median list price down 4.0%.
Inventory is higher than a year ago in both geographies, but the City of Austin's absorption rate has actually improved — months of supply dropped from 6.25 to 5.40 despite more listings. That is a sign of demand holding up in the urban core even as prices adjust. The rise in above-list-price closings from 10.81% to 13.39% month over month adds another data point suggesting that well-priced homes in the right areas are still generating competition.
For buyers, the data supports a measured, informed approach. Nearly two-thirds of homes are selling below list price, the sold-to-list ratio is 97.28%, and zero cities and zero ZIP codes are at peak prices. Negotiating room exists across the board, though that room is not uniform. For sellers, accurate pricing is the most important variable in the current market. The data does not support aggressive pricing above recent comps, but well-positioned homes are still closing, and some are closing above list.