

Austin’s Bifurcated Housing Market: High vs Low Price Trends 2025
Published | Posted by Dan Price
Austin’s Divided Housing Market: High-End vs. Low-End Price Trends in 2024-2025
Austin’s housing market moves in two directions at once, creating a split that affects home buyers, sellers, and investors differently depending on price ranges. Data from Team Price Real Estate’s analysis for April 2024 to April 2025 shows how high-end homes, those in the top 25% of prices, often behave differently than low-end homes in the bottom 25%. By comparing home prices and price per square foot across cities and zip codes in the Austin area, this report reveals a divided, or bifurcated, market where pricier homes hold stronger value even as sales drop and more homes sit unsold. This pattern explains why overall prices can rise despite a quieter market, offering a clear picture of Austin’s complex trends.
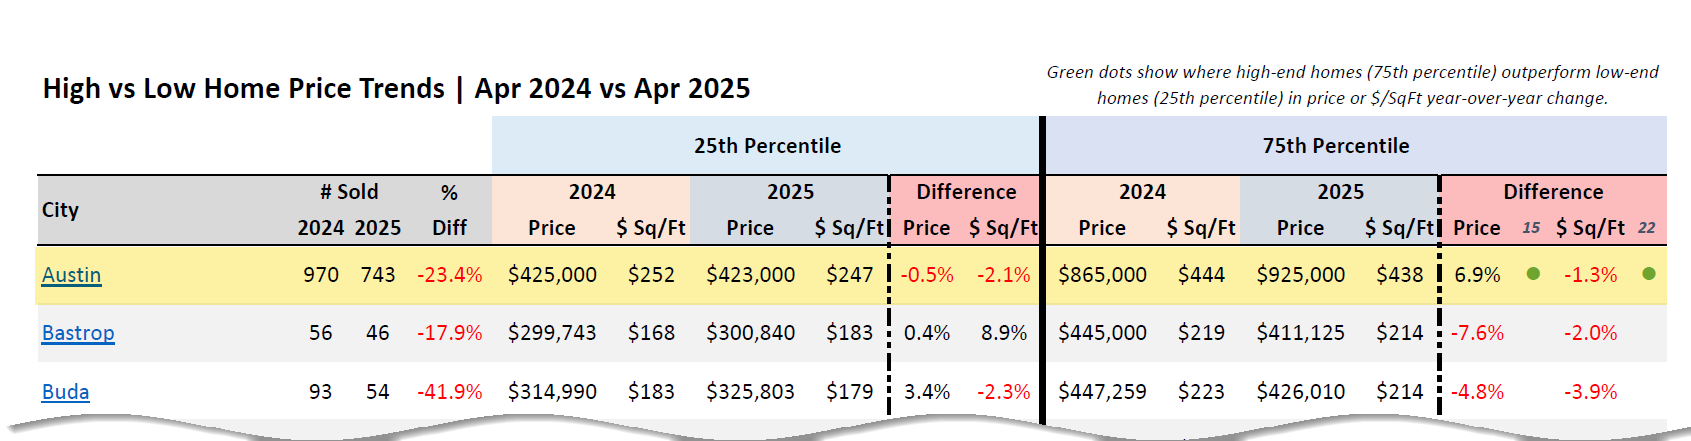
In the city of Austin, home sales fell 23.4% from 970 in April 2024 to 743 in April 2025. Yet, the median sold price climbed 4.39% to $595,000, and the average sold price rose 5.91% to $801,260. High-end homes at the top 25%, or 75th percentile, increased 6.9% to $925,000 from $865,000, while low-end homes at the bottom 25%, or 25th percentile, dipped 0.5% to $423,000 from $425,000. The price per square foot for high-end homes dropped 1.3% to $438, but this was less than the 2.1% decline to $247 for low-end homes. These numbers show pricier homes pulling ahead, driving up city-wide prices even as fewer homes change hands.
This split repeats in other cities. Kyle saw sales plummet 35% from 120 to 78 homes. Its high-end homes fell 3.7% to $409,375 from $424,993, but low-end homes dropped more, 6.6% to $289,250 from $309,675. High-end price per square foot in Kyle ticked up 0.7% to $202, while low-end homes lost 3.6% to $160. In Leander, sales shrank 44.1% from 161 to 90 homes. High-end homes decreased 9.7% to $613,748 from $680,000, less than the 10.3% fall to $336,250 from $375,000 for low-end homes. High-end price per square foot held nearly steady, down 0.7% to $238, compared to a 2.1% rise to $194 for low-end homes, which reflects inconsistent low-end gains.
Georgetown’s sales edged down 5.5% from 236 to 223 homes, with high-end homes gaining 5.5% to $613,122 from $581,425, while low-end homes crept up 0.4% to $379,490 from $377,833. The price per square foot for high-end homes slipped 1.7% to $242, but low-end homes fell further, 3.1% to $190. Buda faced a steeper 41.9% sales drop from 93 to 54 homes. Its low-end homes rose 3.4% to $325,803 from $314,990, but high-end homes declined 4.8% to $426,010 from $447,259. Price per square foot dropped 3.9% to $214 for high-end homes and 2.3% to $179 for low-end homes, showing high-end homes losing less ground in some metrics.
Zip code data zooms in on local trends. In Austin’s 78748, sales decreased 22.9% from 48 to 37 homes. High-end homes jumped 19% to $595,000 from $499,999, with price per square foot up 7.7% to $291 from $271. Low-end homes, however, fell 2.2% to $410,000 from $419,250, with a slight 0.6% rise to $216 per square foot. In Kyle’s 78640, sales dropped 38.9% from 144 to 88 homes. High-end homes edged up 1.6% to $398,170 from $391,999, while low-end homes fell 6.7% to $280,000 from $299,998. High-end price per square foot dipped 0.5% to $199, but low-end homes lost 5.6% to $158, highlighting the high-end’s relative strength.
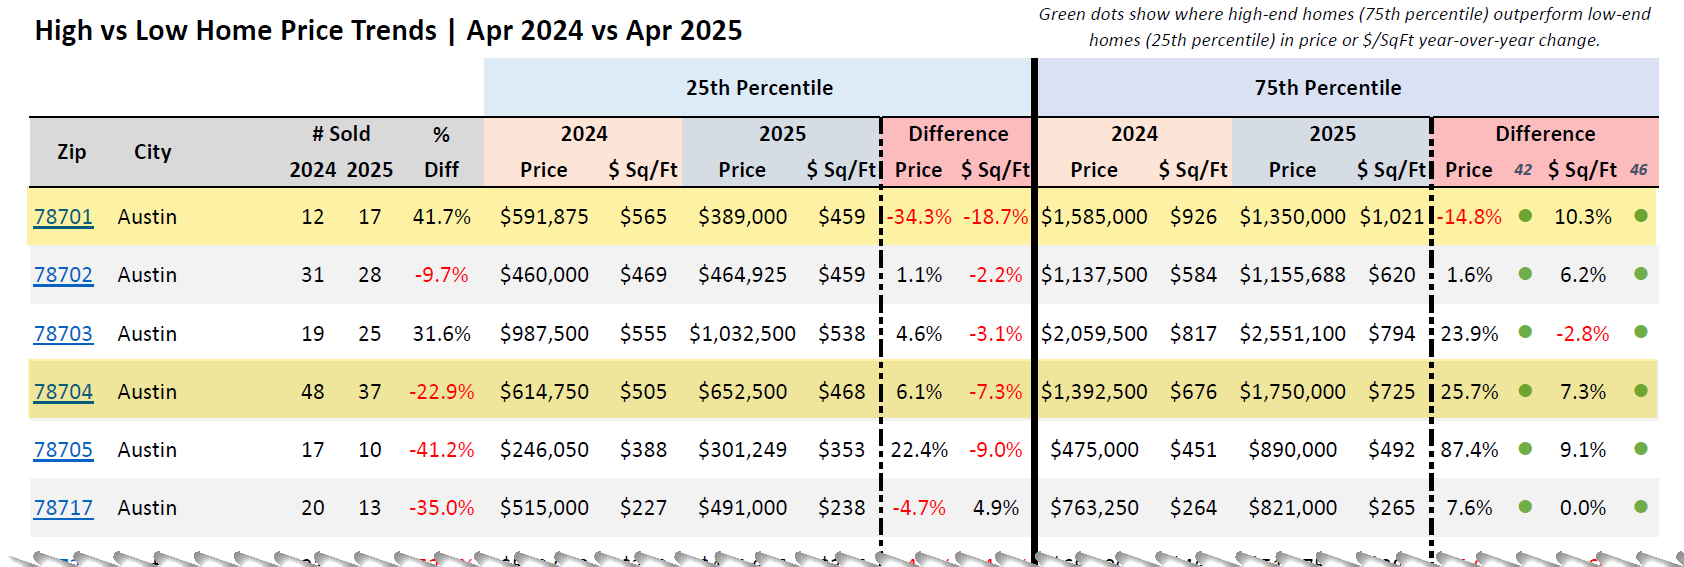
Downtown Austin’s 78701 saw sales rise 41.7% from 12 to 17 homes, but prices told a split story. High-end homes fell 14.8% to $1,350,000 from $1,585,000, far less than the 34.3% plunge to $389,000 from $591,875 for low-end homes. High-end price per square foot gained 10.3% to $1,021 from $926, while low-end dropped 18.7% to $459 from $565, creating the largest gap in performance. In 78704, sales fell 22.9% from 48 to 37 homes, but high-end homes soared 25.7% to $1,750,000 from $1,392,500, with price per square foot up 7.3% to $725 from $676. Low-end homes gained 6.1% to $652,500 from $614,750, but their price per square foot fell 7.3% to $468.
Smaller markets can swing sharply. Driftwood, with just 3 sales in 2025 down from 9, saw high-end homes rise 9.1% to $1,200,000 from $1,100,000, while low-end homes spiked 38.6% to $1,150,000 from $830,000. Manchaca’s 4 sales, up from 1, showed high-end homes dropping 30% to $460,625 from $658,000, and low-end homes falling 42.7% to $377,000. These shifts, driven by low sales, contrast with broader trends where high-end homes often fare better, as seen in zip codes like 78705, where high-end prices leaped 87.4% to $890,000 from $475,000, and price per square foot rose 9.1% to $492 from $451, despite only 10 sales.
Inventory data adds context to this divide. Austin’s total active listings grew 13.34% to 4,810 from 4,244, with months of inventory up 17.63% to 5.95 from 5.06. Across the Austin-area MLS, listings rose 11.15% to 15,507 from 13,951, and months of inventory increased 26.73% to 5.35 from 4.22. More homes are available, especially at lower price points, which sell less often, while high-end homes keep moving, lifting prices.
Cedar Park’s sales fell 13.9% from 72 to 62 homes, with low-end homes up 6.4% to $427,750 from $402,188, outpacing high-end homes’ 4.2% rise to $725,750 from $696,250. High-end price per square foot dropped 1.4% to $255, less than the 2% fall to $208 for low-end homes. Lakeway’s sales declined 29% from 31 to 22 homes, with high-end homes falling 5.8% to $891,250 from $946,000, less than the 14.5% drop to $481,000 from $562,500 for low-end homes. High-end price per square foot rose 12.1% to $349, far ahead of the 2.9% gain to $248 for low-end homes.
The data shows no strong link between a zip code’s overall price level and its performance. Higher-priced zip codes, like 78746 with an average price around $1.87 million, saw high-end homes gain 46.8% to $2,781,250, but others, like 78735, lost 45.8% to $935,000. Lower-priced zip codes, like 76537 Jarrell averaging $277,188, had high-end homes drop 0.7% to $299,419, while 76574 Taylor’s high-end homes surged 46.6% to $492,495. Performance varies more within zip codes—high-end homes often beat low-end ones—than between price tiers, reinforcing the market’s split nature.
This divided market, where high-end homes frequently outperform low-end ones, shapes Austin’s housing trends. Zip codes like 78701, with a 19.5% price gap and 29% price-per-square-foot gap between high-end and low-end homes, highlight this divide most starkly. Across the region, the data shows why prices rise even as sales slow, with pricier homes leading the way in value and activity, while cheaper homes lag, creating distinct paths for different price ranges.
FAQ Section
Why are Austin’s home prices rising when fewer homes are selling?
Austin’s home prices are increasing because high-end homes, those in the top 25% of prices, tend to sell more often and hold or gain value compared to low-end homes. For example, in April 2025, high-end homes in Austin reached $925,000, up 6.9%, while low-end homes fell 0.5% to $423,000, pushing overall prices higher despite a 23.4% drop in sales.
What is a bifurcated housing market in Austin?
A bifurcated housing market in Austin means high-end homes, in the top 25% of prices, perform differently than low-end homes, in the bottom 25%. Data from April 2024 to 2025 shows high-end homes, like those in zip code 78748 gaining 19% to $595,000, often outpace low-end homes, which fell 2.2% to $410,000, creating a split in market trends.
How does inventory affect Austin’s housing prices?
Inventory in Austin grew 11.15% to 15,507 listings in April 2025, with months of inventory up 26.73% to 5.35. More low-end homes sit unsold, slowing their sales, while high-end homes keep selling, maintaining stronger prices. This imbalance helps drive overall price increases, even with fewer total sales.
Related Articles
Keep reading other bits of knowledge from our team.
Request Info
Have a question about this article or want to learn more?
